

BACK TO BLOG Blog
Price Sensitivity Analyses
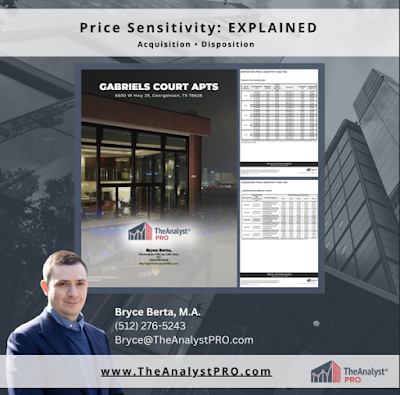
Acquisition • DispositionPrice Sensitivity: Explained
 |
| sample created by Bryce Berta |
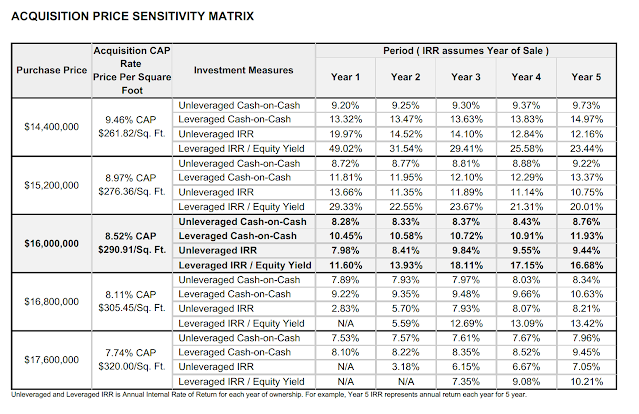
Looking at this matrix, we can see that the asking price of $16,000,000 gives us a CAP rate of 8.52% based on our assumed cash flows. But what if we get into a bidding war and have to pay 5% or 10% above ask? Well, that would push CAP rates down to 8.11% and 7.74% respectively. Looking down the line, we can see that our IRR and Cash on Cash would be impacted fairly significantly. On the other hand, if we can negotiate the price down by 5% or 10%, the reverse would be true.
 |
| sample created by Bryce Berta |
What about when we go to sell this asset? What does the future hold? Well, we can set a range of possibilities and project what the impact of those possibilities would be. In this instance, I set our assumed disposition CAP rate to 8% and set the matrix to a half a percent and full percent both above and below. If I thought there was going to be more volatility, I could set this range to be as wide or as narrow as I want.
Now, we can see what would happen if we sold this asset at each of these given CAP rates over the next five years. We can see the appreciation or depreciation of this property’s value. We can see what the actual sales price would be as well as our overall Internal Rate of Return.
If you are a sophisticated investor and have a hard drive full of Excel models, this may be something you could do in an afternoon. But, for someone with a subscription to TheAnalyst PRO, this is a 20 minute task. No finance degree required.